Back in 1985 we warned that the sovereign debt
crisis would emerge and start to really surface for 2015.75. Why this date was
forecast so far back? This is Pi – 31.4 years into this Private Wave which
began 1985.65.
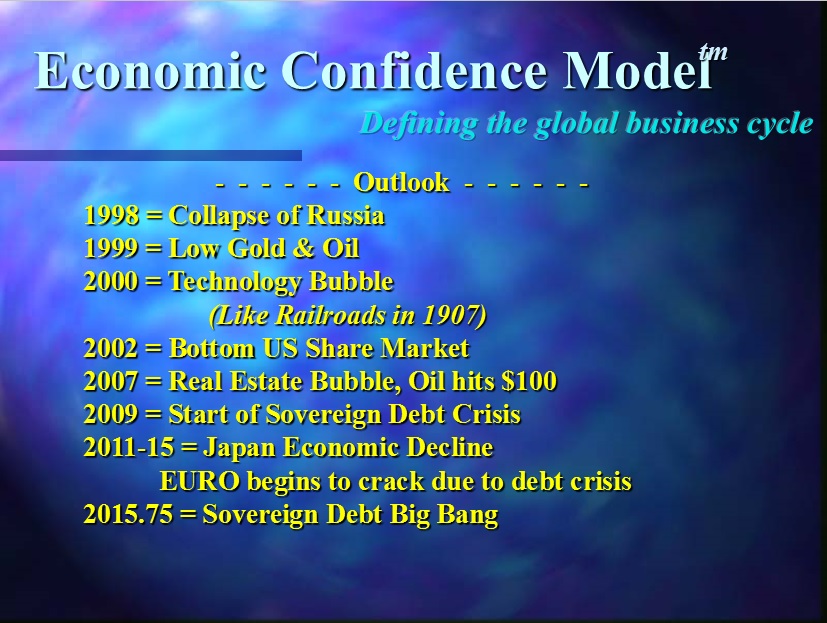
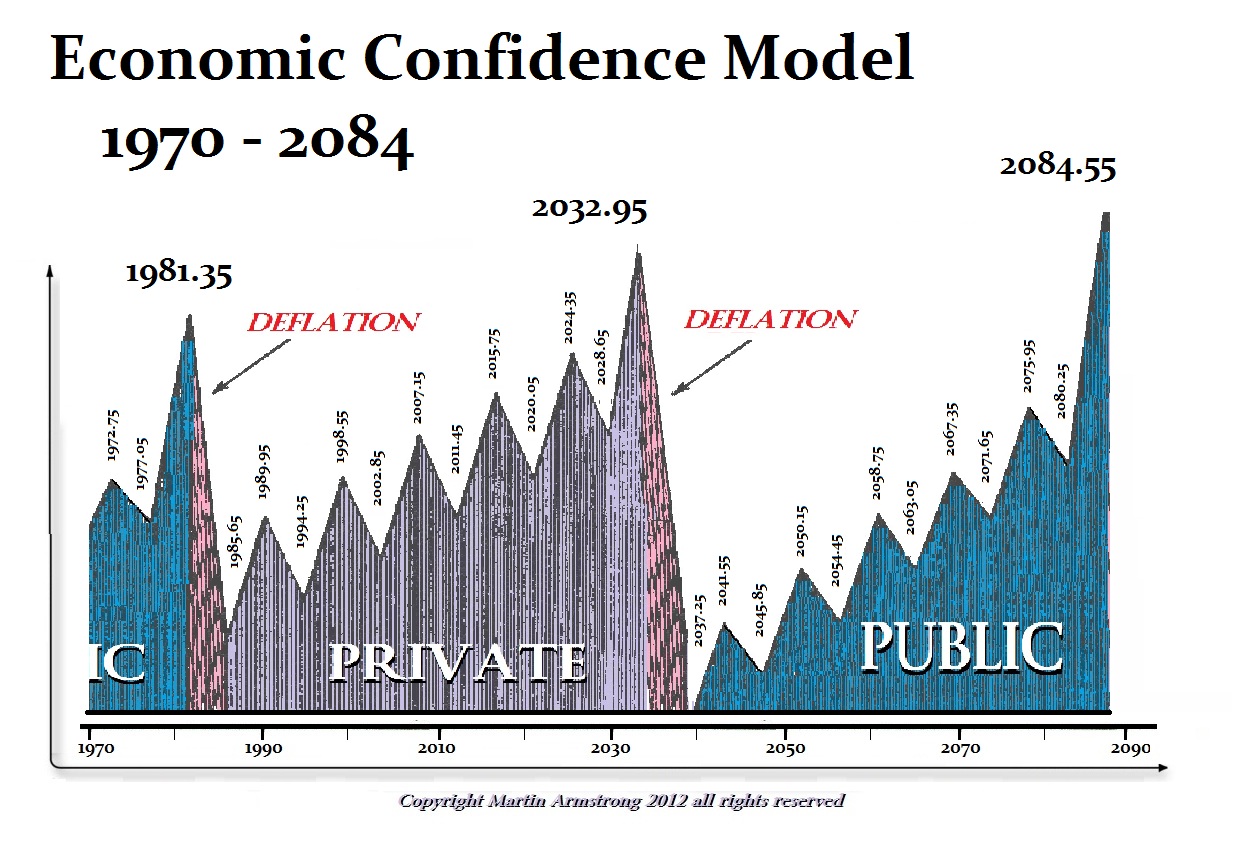
At the 1998 World Economic Conference, we put
out this slide with the sequence of events. One question people often ask is
how on earth can we make long-term forecasts like this. Such forecasts are only
possible with a vast data base. Without that, you cannot even begin. So for all
those who are trying to copy our forecasts the real question is – how did they
do this without data?
The revelation in forecasting
is opposite of what most people assume. They think it is impossible to forecast
the long-term and assume the short-term can be done by monitoring fundamental
events. The truth is quite shocking. Forecasting the long-term tends to be much
easier than forecasting where the Dow will close tomorrow. Why? The short-term
is just noise, yet it gets everyone wound up. Every $20 rally in gold brings
out the charlatans claiming this time it is it. In reality, the trend cannot be
manipulated nor changed even by government for the collective forces of the
free market will always win. Even Paul Volcker, former Chairman of the Fed put
out his “Rediscovery of the Business
Cycle” stating this simple fact – the era of “new economics”
(Marxist-Keynesianism) which claimed government could eliminate recessions and
the business cycle failed.
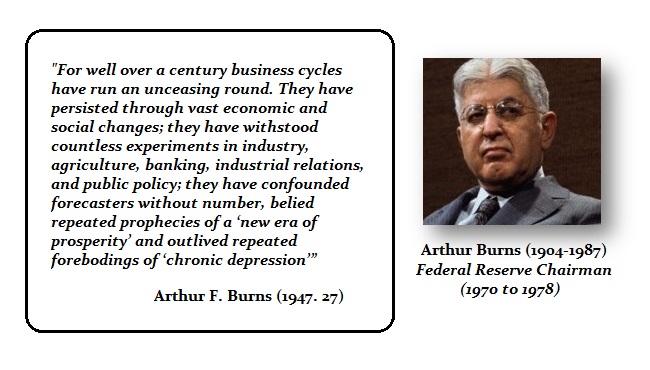
Then there was Arthur Burns, the Fed Chairman
who presided over the birth of the floating exchange rate monetary system in
1971. He too wrote that the business cycle was really INVICTUS (invincible).
Yet despite all the behind the curtain admitting that the Free Market always
wins, the press, academics in general, and government constantly tell you there
is no cycle and you cannot forecast the future so do not listen. Then they
immediately forecast strong economic growth the following year.
So the real question should be; Why does the
establishment (government, academics & press) tell you it is impossible
when this is not the case? Even Volcker stated the business cycle was about 8
years. The plain and simple truth is they do not want you to think there is a
business cycle for then why do we need them? All they attempt to do is
manipulate the people to defeat the business cycle, which NOBODY HAS EVER
ACCOMPLISHED EVEN ONCE LONG-TERM.
Well, 2015.75 is next week. Long-term forecasts
are far more accurate than short-term because you cannot defeat the trend no matter
what you do. It’s Just Time. You cannot make up such forecasts
with personal opinion no matter how so many are trying mimic us with nothing
but opinion. It takes a database and you will only see the trend by correlating
everything that moves. One Asian government understands this perhaps best than
the West and offered $500 million for a copy of what we have.
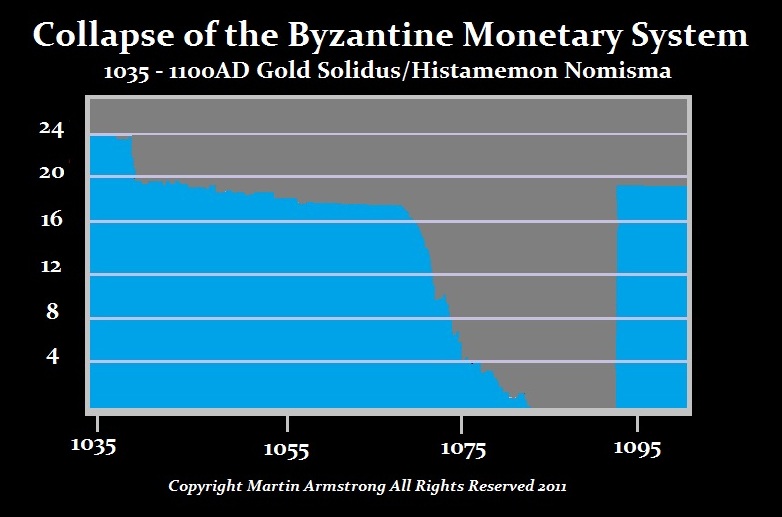
When we say we have the largest database, it is
no joke. Debt has always been the great destroyer. It has toppled every empire
known to history. We have compiled debt along with currency movements back into
ancient times as well as catalogued ancient financial panics as was the case in
Athens back in 354BC. Above is a chart of the
Venetian Empire based upon the gold Ducat and it lasted also hundreds of years.
Gold did not prevent its demise
either.
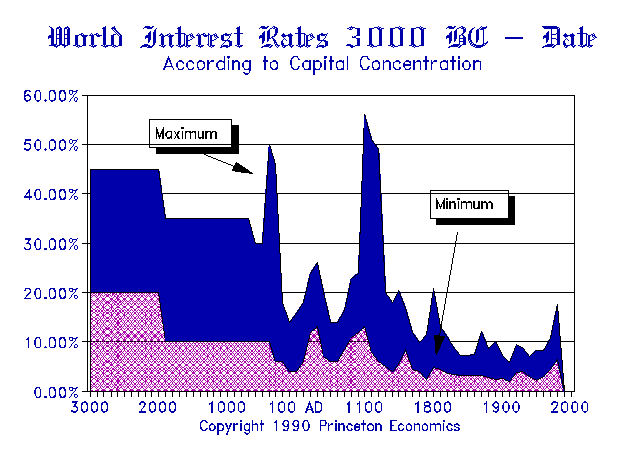
We have tracked debt and interest rates from the core to the peripheral
economies to understand capital concentration. When capital concentrates,
interest rates decline in that region. This demonstrates how the financial
capital of the world even migrates with time.
We have used the coinage to determine money
supply. Since coin dies were hand-carved, each is unique. Taking someone with
modern dies and having them strike coins with a hammer to see how many coins
can be produced before a die will break gives us an average. Then cataloging
all the known dies results in the money supply.
We have mapped everything from the birth of coinage
during the 7th century BC on through Greece, Rome, and Byzantium. With the fall
of Byzantium, the financial capital shifted to India as a region. India was not
a unified country, but city states that also engaged in conquest and warfare.
Just how do these people pretending to be forecasting a great crash arrive at
such an “opinion” without a database? They do not understand what we are forecasting
and are incapable of projecting even the turning points from a gut opinion
perspective.
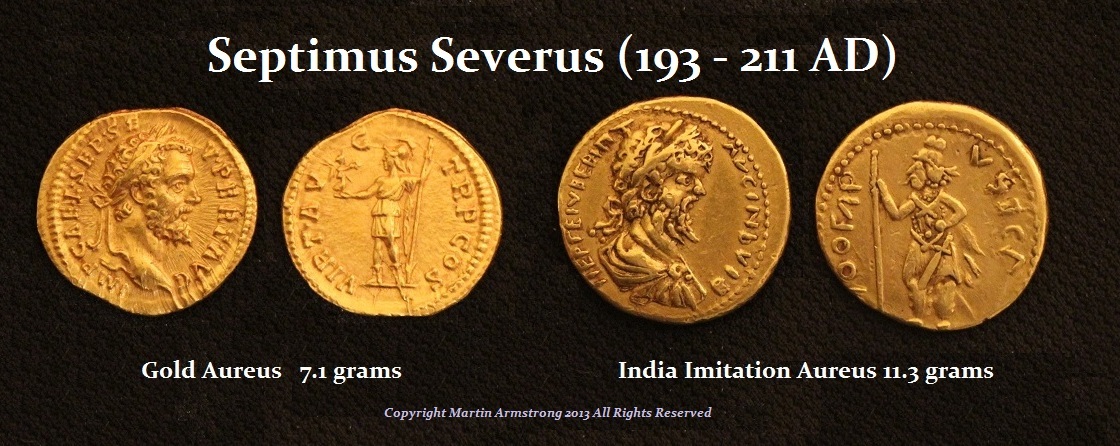
We have assembled “imitation” Roman coinage from
the outer trading partners. We can see Roman coins were being imitated in India
even back into the earliest part of the Imperial era. Yet the history of
Rome that claimed to rule the world (orbis terrarum) stood at the
opposite end of the world from the strikingly similar Han Dynasty (206BC-220AD)
in China, which also claimed to have ruled the world (tianxia).
There is the History Book for Tang-Dynasty in China covering the period
618-907AD. Yet the text mentions 17 times what appears to be the Roman Empire .
It also describes an envoy that was sent by the Roman Emperor to China. The
Roman Emperor was recorded to have been “Anton” or Marcus
Aureius Antoninus. The account of such an envoy who visited the older Han
Dynasty predates the Venetian traveler Marco Polo (1254-1325) by more
than 1,000 years. We have assembled trade flows – everything we could lay our
hands on has been collected.
So as we approach 2015.75, you can see this
trend changing. This is a 5000 year low in interest rates showing the excessive
hoarding and concentration of capital in the West. We can also see the debt
crisis is unfolding, not just with Greece, but now we are seeing downgrades of
France and Japan last week. The trend is so obvious and concentrated in our
debt problems as emerging markets have issued since 2007 dollar denominated
debt about half that of the entire debt of the United States. We are seeing
economic chaos unfold in Brazil and Venezuela. The insane construction of the
euro have undermined the entire European banking system and the solution of the
ECB, hide the truth.
We have the US debt ceiling coming up the very
day of the turning point in the USA and this time religion is involved. This
has led in part to the resignation of Boehner for he has deliberately funded
efforts to defeat anyone within the Republican Party who stood for fiscal
conservatism. Then we have Trump rising in the poles because he is not
beholding to anyone else.
As 2015.75 emerges, we will move into the Pi
target from the start of the Economic Confidence Model 1985.65. This will bring
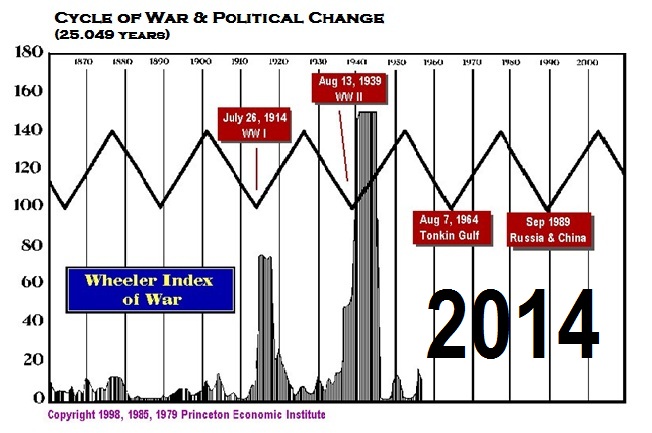
us to January 2017 (2017.05). This is also the target on the Cycle of War. The
correlation between our models for 2017 will be the topic for the World
Economic Conferences in Princeton & Berlin. We will have two years ahead of
us and 2015.75 is just the BEGINNING – NOT THE END WITH SOME ONE TIME CRASH
EVENT. This is a major change in trend of monumental proportion.
Our Cycle of War used as the seed the Wheeler
Index. However, there were some major problems with key events that were
overlooked. So we corrected the data and then extended it for the period
following his death. We then created a parallel index correlated to economics.
The next result was a series of cycles appeared and a correlation with the
economy emerged very clearly interfaced with debt. The fundamental principle to
emerge from that work was the fact that we could both distinguish between
domestic civil unrest which begins and at times moves into revolution, and
international events. There are interesting political responses which often
determine the outcome.
On the international level, war emerges from two
separate trends. First there is the more traditional trend where the economy
turns down which results in government needing too find an external enemy or
there will be civil unrest that overthrows the government. This version is
intertwined with the Civil Unrest Model and is often the escape value for government
to retain power. Here the domestic unrest model can be transformed into an
international conflict if politics is desperate to save itself and sees that
way out.
The second trend stands in contrast to the first
in what we identified as the Conquest Model whereby governments seek to
expand their territory for money and power detached from economic pressure
caused by a decline. This can be seen as Alexander the Great, Rome, Charlemagne
and Japan, etc. The subdivision of the international conflict level we
call the retribution model whereby there is a preceding economic crisis. This
subdivision is illustrated by Napoleon and Hitler. These were trends that were
also an admixture between domestic economic problems that leads to war as in
the case of Napoleon and Hitler as distinguished from a pure power expansion.
Creating a database that could distinguish all
these moving parts was key to creating our model for the Cycle of War ™ which
others have tried to mimic without the database assuming all we did was use the
Wheeler Index. The cycle frequency we discovered is not discoverable from using
just the Wheeler Index.
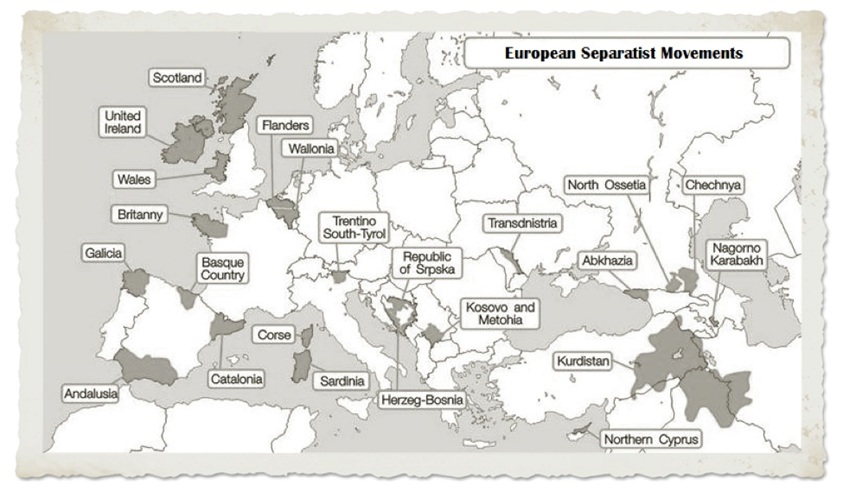
Here is what we see for Europe. There are many
rising trends toward separatist movements. This will rise further and we will
see this begin to emerge as a far more common trend over the next two years.
This weekend, we have the Catalan Vote which cannot be suppressed and it
should trigger unilateral steps towards region’s secession from Spain. Keep in
mind that Spain was formed with the marriage of Ferdinand and Isabella. Catalan
independence seeks to reverse that merger and this is being driven by the
insanity of Spain trying to stay inside the Euro forcing austerity and rising
taxation upon the people in the midst of wholesale corruption.
Now in Texas, we have seen a consistent
separatist movement for years. Now a nationalist group wants Texas Secession on
the Primary Ballot. Even the resistance to Gay
Marriage is a key to rising separatist movements within the USA and the Tea
Party is also a reflection of the clash in philosophy where one nation for all
shoving down the throats of everyone a central policy is starting to irritate
people and when the economy turns down, this will flare up even more.
We see this trend rising in Canada with Quebec
and we will see this trend emerge where Staten Island will seek to separate
from New York City.
Welcome to the other side of 2015.75
A weak session for Equities in Asia (Nikkei
-2.7%), Europe (DAX -1.97%) and the US (DOW -0.5%)had Fund Managers searching
for both answers and safe-havens. One market that benefited was the Bond Market
with US Treasuries and Bunds both pushing yields back lower. The US 10yr
managed a break below the 2.10% yield to a daily low of 2.078%. This move
by US market managed to tighten the TY/RX spread back into +148bp. However, the
European peripheral markets all made gains against core after MR. Draghi
alluded to additional QE at his speech late on Wednesday. The other market that
made gains were precious metals where Gold broke above recent
highs ($1137) closing at $1155 (+1.93%) whilst Silver also rose +2.24%.
The US Dollar Index (DXY) spent the majority of
the day trading around unchanged (96.10); at least until Janet Yellen addressed
the press from MIT late in the day. The first comment that the FED still
expects to move rates in 2015 was all it needed to move the US Dollar
stronger. Immediately, both the Euro and GBP lost around one big
figure each pushing the crosses back to the days lows of
1.1170 and 1.52 respectively.
Although the majority of her address was anchored on inflation her opinion does offer a confused view. Arguing the limits of the Philips Curve she expressed a contrast with the real world. Monthly payrolls close to 210k and its expected continued performance, the assumption that energy prices do not fall too far from their current levels and the assumption the economy will not be hindered by a stronger US Dollar the FED are comfortable with rates moving later this year with additional increases over time.
Although the majority of her address was anchored on inflation her opinion does offer a confused view. Arguing the limits of the Philips Curve she expressed a contrast with the real world. Monthly payrolls close to 210k and its expected continued performance, the assumption that energy prices do not fall too far from their current levels and the assumption the economy will not be hindered by a stronger US Dollar the FED are comfortable with rates moving later this year with additional increases over time.
The last five minutes Yellen repeated many of
the sentences she had already quoted. She was becoming ill and the Secret
Service dismissed anything serious saying she was dehydrated and is getting
medical treatment. Nevertheless, it was these long periods of silences that
many questioned what was going on. She obviously had the speech prepared and
read directly from it illustrating how things are orchestrated.
We will be sending out the gold update to the
2014 Precious Metals Report next week. The update will be exclusively for those
who have purchased the 2014 Precious Metals report and will cover gold going
into the fall.
The 2015 Precious Metals Report will be issued
in November and will cover the future prospect for precious metals moving
forward in the final role for the hedge against government.
It’s 190600, not 1980600. Hey, I never took typing is high school.
Posted